

Netdata is an open-source server monitoring application that tracks server performance in real time. With this application, you can view CPU, RAM, disk I/O, network bandwidth usage, and even application activity on your server. All data is displayed in interactive graphs via a web-based dashboard, making it easier to understand, even for beginners.
In this article, we will show you how to install and configure Netdata for lightweight real-time server monitoring.
Some of the key features available in Netdata include:
- Real-time monitoring: Displays live server data without delay.
- Interactive dashboard: Information is presented in easy-to-read graphs and charts.
- Multi-system support: Can be used to monitor Linux, macOS, Windows (limited), and even containers like Docker.
- Notifications: Can be configured to alert you when your server experiences a resource spike.
- Lightweight: Netdata is designed to avoid overloading your server, even when running continuously in the background.
Prerequisites
- A Linux server
- SSH access with sudo privileges, or root access
Conventions
# – given commands should be executed with root privileges either directly as a root user or by use of sudo command
$ – given commands should be executed as a regular user
Step 1. Install Netdata
Netdata provides a one-click installer for various Linux distributions, which is the standard method recommended on the Netdata Cloud dashboard. To get the list of supported Linux distributions, you can refer to their page. Now, we can run the one-click installer to install Netdata on our system.
# wget -O /tmp/netdata-kickstart.sh https://get.netdata.cloud/kickstart.sh && sh /tmp/netdata-kickstart.shThe command above will install everything, including the dependencies, binary download, systemd service creation, and enable auto-updates. You would just need to answer the Yes/No questions and hit ENTER when prompted. Once the installation is completed, you will see an output similar to this:
To view the dashboard, open your web browser and enter http://NODE:19999.
Replace NODE with the IP address or hostname of your Netdata server.

Official documentation can be found online at https://learn.netdata.cloud/docs/.

Looking to monitor all of your infrastructure with Netdata? Check out Netdata Cloud at https://app.netdata.cloud.

Join our community and connect with us on:
  - GitHub: https://github.com/netdata/netdata/discussions
  - Discord: https://discord.gg/5ygS846fR6
  - Our community forums: https://community.netdata.cloud/
[/root]# rm -rf /tmp/netdata-kickstart-TTcjwZlxyU
 OK
Step 2. Configure Netdata
At this point, you should be able to open Netdata at http://YOUR_SERVER_IP_ADDRESS:19999. However, if it’s not starting automatically, simply run the command below:
# systemctl start netdata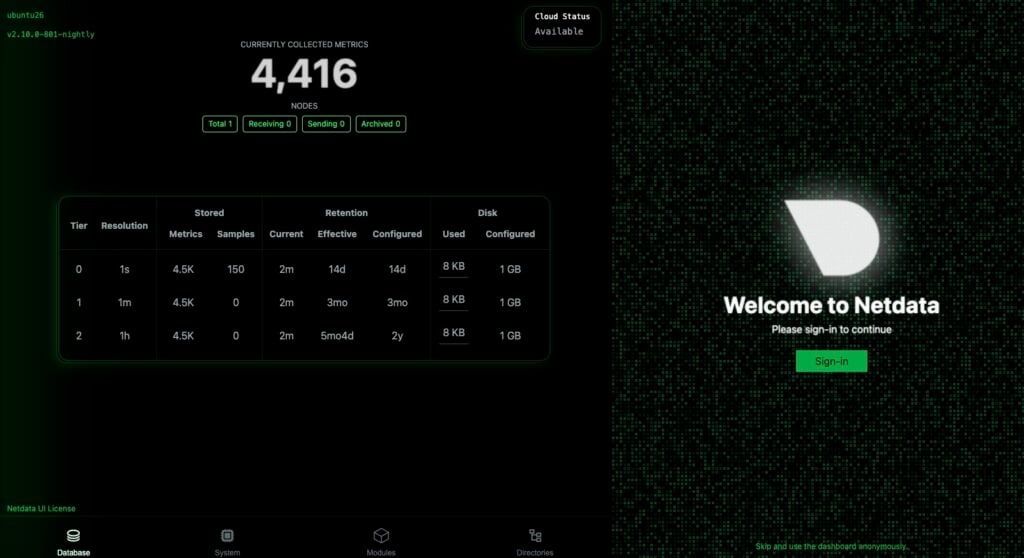
Click on “Skip and use the dashboard anonymously” to go to the dashboard.
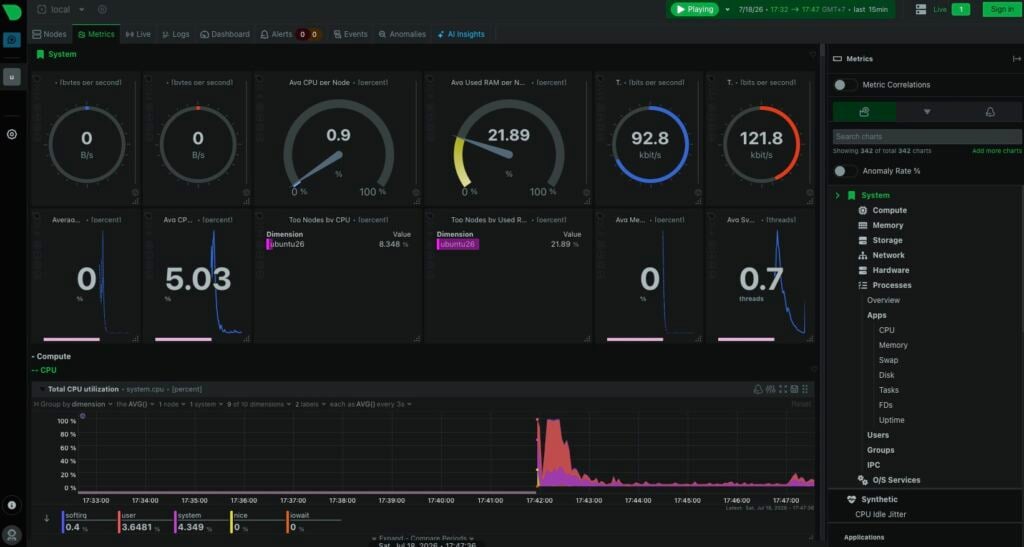
Here, you will see some graphics. In this Metrics tab, you can also see more detailed information about them all by clicking on one of the metric collections on the right, like Compute, Memory, Storage, etc.
At this point, your /etc/netdata/netdata.conf is empty. Let’s run the command below to get the configuration file:
# netdatacli dumpconfig > /etc/netdata/netdata.confStep 3. Configure Reverse Proxy
To secure your Netdata installation and the information it contains, we can install and configure a web server to act as a reverse proxy. In this step, we will install and configure Nginx.
Let’s install it now
Ubuntu/Debian
# apt install nginx -yCentOS/AlmaLinux/RockyLinux
# dnf install nginx -yOnce installed, nginx will run automatically on Debian/Ubuntu. If you are running CentOS/AlmaLinux/RockyLinux, run the command below to enable it.
# systemctl enable --now nginxNext, we can continue with the configuration. Let’s create an Nginx server block.
# nano /etc/nginx/conf.d/netdata.confInsert the following into the file.
upstream netdata {
    server 127.0.0.1:19999;
    keepalive 64;
}

server {
    listen 80;
    server_name netdata.yourdomain.com;

    location / {
        proxy_set_header X-Forwarded-Host $host;
        proxy_set_header X-Forwarded-Server $host;
        proxy_set_header X-Forwarded-For $proxy_add_x_forwarded_for;
        proxy_pass netdata;
        proxy_http_version 1.1;
        proxy_pass_request_headers on;
        proxy_set_header Connection "keep-alive";
        proxy_store off;
    }
}
Save the file, exit, then restart nginx
# systemctl restart nginxNow that you can access Netdata at http://netdata.yourdomain.com, we can either close port 19999 or restrict Netdata to listening only on localhost. Let’s edit the Netdata configuration file.
# nano Find [web] and add this line under that [web] section
bind to = 127.0.0.1Save the file, then restart Netdata
# systemctl restart netdataNow, you should not be able to access Netdata at http://YOUR_SERVER_IP_ADDRESS:19999 because it is now listening only on localhost.
Step 4. Netdata Data Retention
The latest version of Netdata uses a tiered storage engine (dbengine) with three tiers by default, and it actually supports up to 5 tiers. Tier 0 stores per-second data, Tier 1 stores per-minute (aggregated), and Tier 2 stores per-hour (aggregated). The default retention gives you about 14 days of per-second data.
Because Netdata’s compression is highly optimized (~0.5 to 0.6 bytes per metric sample), you can easily scale these up to years of high-resolution history without eating your whole hard drive. To change how long data is stored, edit the configuration file using Netdata’s native configuration tool:
nano /etc/netdata/netdata.confUnder the [db] section, we adjust the retention settings. The key parameters are disk space allocation per tier and time-based retention limits:
[db]
    mode = dbengine
    storage tiers = 3

    # Tier 0 (Per-second)
    dbengine tier 0 retention time = 30d
    dbengine tier 0 retention size = 4GiB

    # Tier 1: Per-Minute Data (Aggregated from Tier 0)
    dbengine tier 1 retention time = 3mo
    dbengine tier 1 retention size = 1GiB

    # Tier 2: Per-Hour Data (Aggregated from Tier 1)
    dbengine tier 2 retention time = 2y
    dbengine tier 2 retention size = 1GiB

    # Tier 3: Per-Day Data (Aggregated from Tier 2)
    dbengine tier 3 retention time = 5y
    dbengine tier 3 retention size = 512MiB
Save the file, then exit. Make sure to restart netdata whenever you change the configuration file.
# systemctl restart netdataNetdata Pros and Cons
These are some pros and cons about Netdata:
Pros
Free: Because it’s open-source, you can use it at no additional cost.
Easy to use: The web-based dashboard simplifies server monitoring.
Detailed & comprehensive: Server information is displayed in great detail, including current processes.
Lightweight: Doesn’t slow down your VPS even when running continuously.
Cons
Limited advanced features: For integration with enterprise monitoring systems, users may need additional tools.
Bringing It All Together
Congratulations! You have learned how to install and configure Netdata for lightweight real-time server monitoring
Of course, you don’t have to install and configure Netdata for lightweight real-time server monitoring if you have an active monthly server management service with us, in which case you can simply ask our expert Linux admins to install Netdata for you. They are available 24×7 and will address your request immediately. Even if you don’t have an active service, you can always make a per-incident server support request, and our admins will sort everything out.
If you liked this post on installing and configuring Netdata for lightweight real-time server monitoring, please share it with your friends or simply leave a comment in the comments section.
