

In this blog post, we will show you how to configure Prometheus and Grafana for Linux Server Monitoring. Linux server monitoring is important because it helps administrators keep systems reliable, secure, and efficient. Servers often run critical applications, websites, and databases, so even small issues like high CPU usage, low memory, disk failures, or network bottlenecks can cause downtime and lost revenue. Monitoring provides real-time visibility into system health and allows teams to detect problems early before they become serious outages. It also improves security by identifying unusual activity or unauthorized access attempts. Tools like Prometheus collect metrics on CPU, memory, disk, and application performance, while Grafana visualizes this information through dashboards and alerts. Together, they help organizations maintain performance, troubleshoot faster, and ensure better user experiences.
Prerequisites
- A Linux Server
- SSH root access, or a user with sudo privileges
Update the System
In this blog post, we will use Ubuntu 26.04 OS. We assume that you have a fresh OS. Before we start with the installation, we need to update the system packages. To do that, execute the following command:
apt update -y && apt upgrade -y
Install Prometheus
Prometheus is an open-source monitoring tool that collects metrics from servers and applications, stores time-series data, and alerts teams. It is included in the latest Ubuntu 26.04 repository, and to install Prometheus, execute the following command:
apt install prometheus -y
Once installed, start and enable the Prometheus service for automatic start on system boot:
systemctl start prometheus && systemctl enable prometheus
To check the status of the service, execute the command below:
systemctl status prometheus
You should get the following output:
root@host:~# systemctl status prometheus
● prometheus.service - Monitoring system and time series database
     Loaded: loaded (/usr/lib/systemd/system/prometheus.service; enabled; preset: enabled)
     Active: active (running) since Sun 2026-05-10 17:24:19 CDT; 9min ago
 Invocation: da8bb45d0bf44103b15952aaae13961b
       Docs: https://prometheus.io/docs/introduction/overview/
             man:prometheus(1)
   Main PID: 133132 (prometheus)
      Tasks: 8 (limit: 3770)
     Memory: 33.5M (peak: 33.9M)
        CPU: 2.380s
     CGroup: /system.slice/prometheus.service
             └─133132 /usr/bin/prometheus
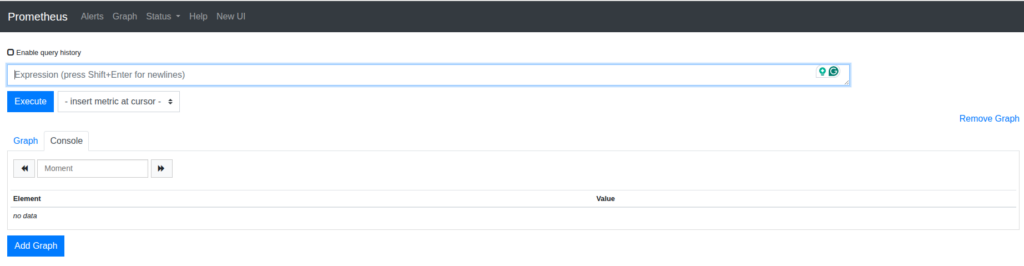
Prometheus is running on port 9090, and to access it in your browser, you can use the following URL:http://YourServerIPAddress:9090.
Install Grafana
Grafana is an open-source visualization platform that turns monitoring data into dashboards, graphs, and alerts for easier system analysis. Grafana is not included in the Ubuntu 26.04 repository, and to install it, first, we need to add the repo by executing the following commands one by one:
apt install -y apt-transport-https

wget -q -O - https://apt.grafana.com/gpg.key | gpg --dearmor | sudo tee /usr/share/keyrings/grafana.key > /dev/null

echo "deb [signed-by=/usr/share/keyrings/grafana.key] https://apt.grafana.com stable main" | sudo tee /etc/apt/sources.list.d/grafana.list

apt update
Once the repo is added to install Grafana, execute the following command:
apt-get install grafana -y
Once installed, start and enable the Grafana service for automatic start on system boot:
systemctl start grafana-server && systemctl enable grafana-server
To check the status of the service, execute the command below:
systemctl status grafana-server
You should get the following output:
root@host:~# systemctl status grafana-server
● grafana-server.service - Grafana instance
     Loaded: loaded (/usr/lib/systemd/system/grafana-server.service; enabled; preset: enabled)
     Active: active (running) since Sun 2026-05-10 18:06:04 CDT; 14s ago
 Invocation: b2b9b98ff1604e46a5bd48e8832b720f
       Docs: http://docs.grafana.org
   Main PID: 134253 (grafana)
      Tasks: 15 (limit: 3770)
     Memory: 149.8M (peak: 150M)
        CPU: 5.703s
     CGroup: /system.slice/grafana-server.service
             ├─134253 /usr/share/grafana/bin/grafana server --config=/etc/grafana/grafana.ini --pidfile=/run/grafana/grafana-server.pid --packaging=deb cfg:default.paths.logs=/var/log/graf>
             └─134412 /usr/share/grafana/data/plugins-bundled/elasticsearch/gpx_grafana_elasticsearch_datasource_linux_amd64
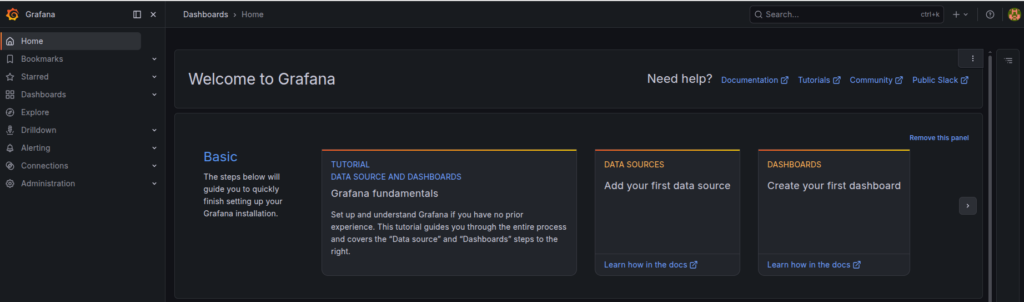
Prometheus is running on port 3000, and to access it in your browser, you can use the following URL:http://YourServerIPAddress:3000. The default username and password are admin/admin respectively, and after the first login, you can set up a new strong password.
Connect Grafana to Prometheus
Grafana is connected to Prometheus because Prometheus collects and stores system and application metrics, while Grafana visualizes those metrics through interactive dashboards, graphs, and alerts. Together, they help teams monitor performance, detect issues quickly, and analyze infrastructure and application health in real time.
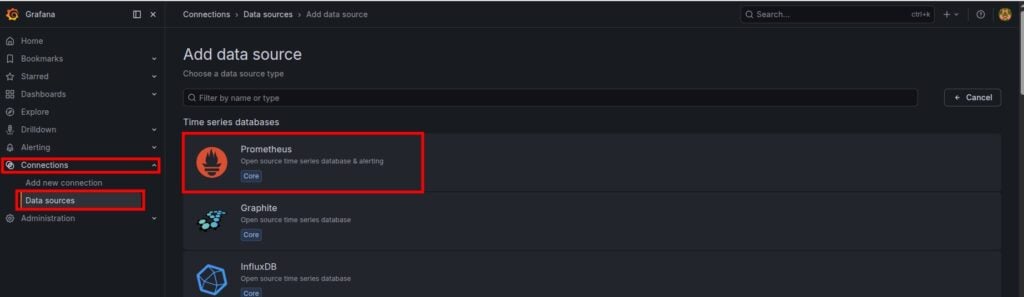
To connect Grafana to Prometheus, first log in to Grafana, then navigate to Connections -> Data Sources -> Add Data Source and select Prometheus
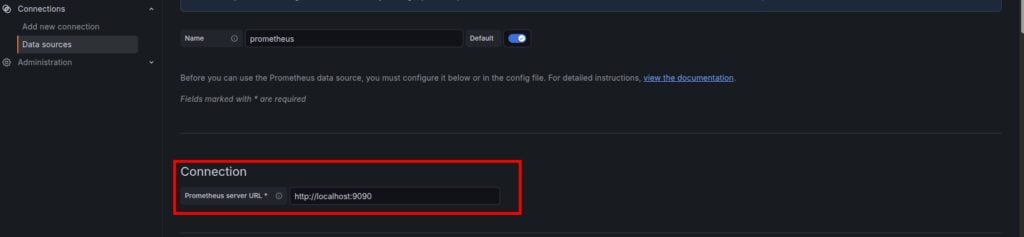
Then, in the Connection field, set the URL to http://localhost:9090 and click on Save & Test at the bottom of the window.

If everything is OK, you should see the following:

In Conclusion
That’s it. You successfully installed Prometheus and Grafana on the Linux server.
If you have difficulties with this installation, our Linux admins will help you with any aspect. You need to sign up for one of our monthly server management or per-incident server support plans. Do not hesitate to contact us anytime. We are available 24/7.
If you liked this post about installing Prometheus + Grafana for Linux Server Monitoring, please share it with your friends or leave a comment below.